Home > Blog > 6 Important Data Analytics Lifecycle Phases with Diagram
6 Important Data Analytics Lifecycle Phases with Diagram
By Upskill Campus Published Date: 12th February, 2024Uploaded By: Priyanka Yadav
Table of Contents [show]
The Data analytics lifecycle is the best plan, specially created for oversized data challenges and cool data science projects. It helps us deal with lots and lots of information. Apart from that, it's not a one-time thing; it's a loop. To make sense of the big data world, we need a step-by-step plan for success. We start by collecting all the data, then clean them up and ensure they fit together.
Next, we use special tools to determine what the data tells us. Once we're sure, we make the information easy to understand with pictures and charts. The final step is turning our ideas into action – improving items or improving how things work. We also keep an eye out and make things even better as we go along.
Why is the Data Life Cycle Important?
The data analytics lifecycle helps you figure out why some things work and others don't in your business. In addition, it is handy for figuring out why customers do what they do, giving you a peek into their thoughts.
The info you get from the life cycle of data analyst is like gold, especially when it comes to understanding your customers.
The life cycle of a data analyst has six steps that are like magic spells for understanding your data.
It is necessary to follow all six steps for remarkable data analysis, even if the order can be mixed up.
It helps your study make sense and gives it a clear direction.
Picking the suitable model for your data is like finding the perfect tool for a job.
Now, we will discuss the various phases of the data analytics lifecycle.
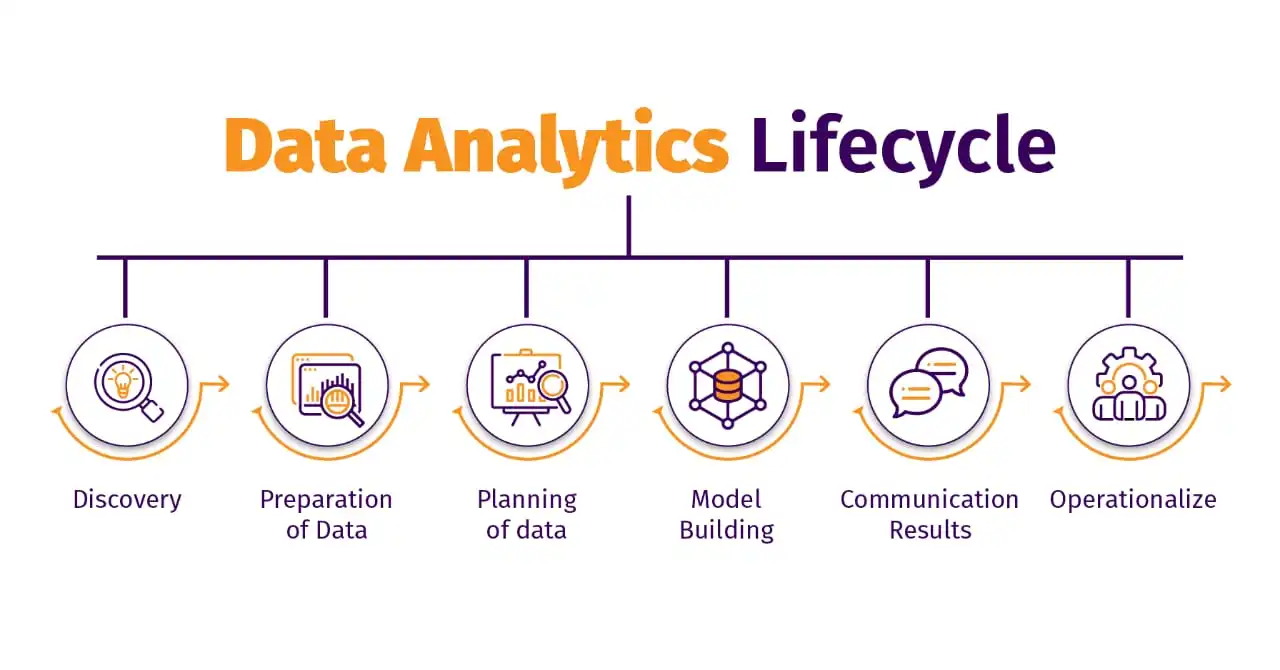
Life Cycle Phases of Data Analytics
Here, we will elaborate on six different phases of the data analytics life cycle.
Discovery
Preparation of Data
Planning of data
Model Building
Communication Results
Operationalize
Now, we will elaborate on each phase of data analytics lifecycle in detail.
Discovery
The data science team starts by learning about the problem they want to solve. It's like becoming a detective to understand what's going on.
Next up, they build context and understanding.
They gather information and make sense of it, so they know what they're dealing with.
The team figures out where to get the data they need.
They identify the sources that will help them solve the problem and make informed decisions.
Armed with knowledge, the team comes up with some first ideas, kind of like making educated guesses. These are called initial hypotheses.
These initial thoughts will be tested later with the actual data to see if they're on the right track.
Preparation of Data
Before diving into the data world, there are steps to ensure everything is set and ready.
The team sets up this unique place, called an analytic sandbox, to execute, load, and transform the data.
The team's job is to make the data look just right before diving into serious analysis. As a result, it assists in giving it a good polish.
These tasks, called data preparation, might happen more than once. Moreover, they don't follow a strict order.
Some common tools they use are Hadoop, Alpine Miner, Open Refine, and more.
Planning of Data
The team starts by exploring the data, like detectives searching for clues to understand how things are related.
They figure out which pieces of information are essential and choose the best models to use.
The data science team creates unique sets of data for training, testing, and putting models into action.
Now, it's time for the team to put their plans into action. They build and run models based on what they discovered in the earlier stages.
In addition, the team relies on tools like Matlab and STASTICA for this part of the data analytics lifecycle.
However, these tools help them create and test models. It makes the whole process smoother and more efficient.
Model Building
Before the real work begins, the team prepares unique sets of data.
They create datasets for testing (like practice rounds), training (to teach the models), and production (for the real deal).
The team takes a moment to think about the tools they have.
They consider if their current tools are good enough for running the models or if they need something more powerful.
They use Rand PL/R, Octave, and WEKA, which are like friendly assistants that don't cost a thing.
Sometimes, for the consequential stuff, you need top-notch tools.
The team turns to commercial tools like Matlab and STASTICA for those particular tasks that need a bit more finesse.
Communication Results
After the team runs their models, it's like checking a test to see how well they did.
They compare the results to their checklist of what's considered successful or not-so-great.
Now, it's time to share the news with the rest of the team and the necessary people involved.
Then, they think about how to explain everything, considering any warnings or assumptions they had along the way.
They put a number on how valuable these findings are for the business. As a result, it turns them into a vital discovery.
They create a story that summarizes everything. However, it makes it easy for everyone to understand what they've uncovered.
Operationalize
Once the team sees the incredible results, they start by communicating the benefits of their project to a wider audience.
They set up a pilot project, like a controlled experiment, to see how well their work performs in a real-world setting on a small scale.
During the pilot project, the team is like scientists running experiments. Moreover, they learn about how the model works and any challenges it might face.
As a result, this helps them make adjustments and improvements before launching the project for everyone.
When everything is ready, it's time to share the final results.
The team delivers reports, briefings (like short summaries), and the unique codes they use.
The team uses some tools – Octave, WEKA, SQL, and MADlib – to make everything work smoothly.
Concluding Words
The phases of data analytics lifecycle are the best practice for turning a bulk of confusing information into really helpful and clever ideas. In short, it is just like a roadmap that helps companies make better decisions by looking at all the necessary steps. Technology gets even more advanced and there's more and more data around. So understanding and following the 6 phases of data analytics life cycle is a super important strategy for being successful.
Frequently Asked Questions
Q1. Why is the data life cycle important?
Ans. The data analytics lifecycle helps you figure out why some things work and others don't in your business. In addition, it is handy for figuring out why customers do what they do, giving you a peek into their thoughts.
UpskillCampus provides career assistance facilities not only with their courses but with their applications from Salary builder to Career assistance, they also help School students with what an individual needs to opt for a better career.


Leave a comment